 CTDS
ML-PEST CTDS · 22 October 2026
Simulation and validation status
Review what the synthetic study demonstrated, where estimates failed, and what remains to be validated.
Simulation evaluated · independent clinical validation pending
The frozen CTDS estimator performed well under matching response-model assumptions, and 30 pulses improved average accuracy compared with 20. Broader response models and stress tests also exposed large errors that could pass the current review-readiness rule. CTDS remains an evaluation aid; independently confirm MT before treatment.
No patients or stimulators were involved. These are simulated performance measures, not clinical error rates or a clinical pass/fail assessment.
Study design
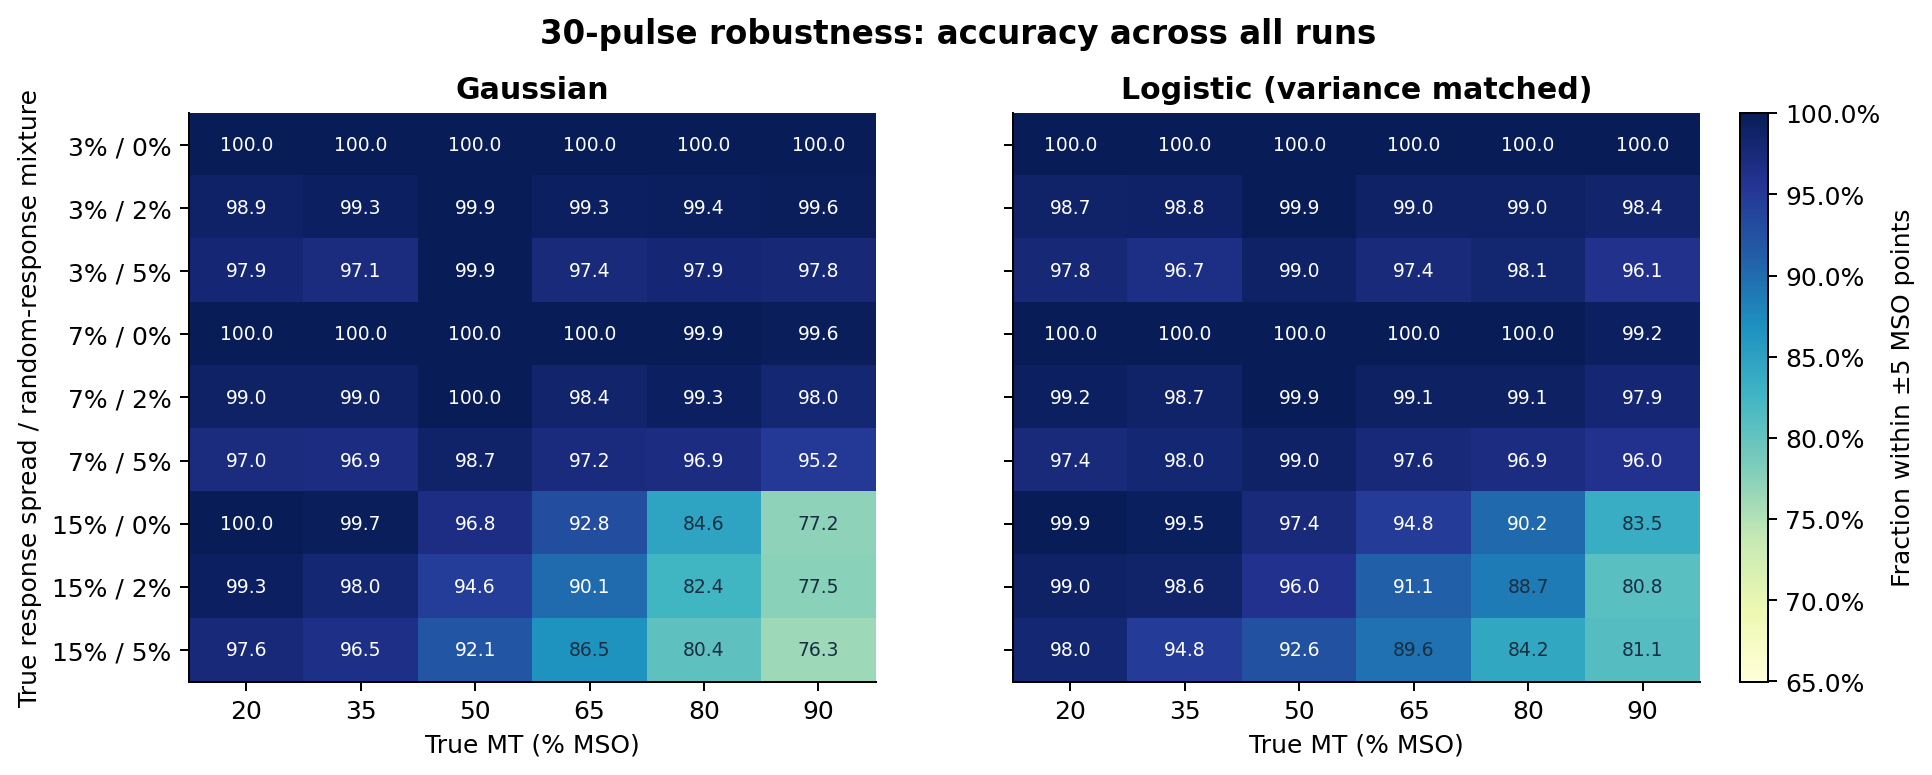
The stationary robustness grid contained 108 scenarios: true MT 20–90% MSO; true response spreads of 3%, 7% or 15% of MT; 0%, 2% or 5% random-response mixtures; and Gaussian or variance-matched logistic response curves. A further 19 scenarios tested drift, incorrect initial responses, ceilings, starting intensities and output boundaries.
The unchanged production estimator used a default first intensity of 37% MSO and fixed 7% model spread. Synthetic response probabilities were generated independently of the estimator. The paired plans shared their first 20 random draws; early stops were retained. Computational anchors were never counted as delivered pulses.
Definitions and analysis scope
The true MT was the known intensity giving a 50% response probability. A 5% random-response mixture creates a 2.5% low-intensity response floor; it does not mean a 5% overall error rate. “Within ±5 MSO points” differs from “within ±5% of true MT”: for true MT 50, an estimate of 55 differs by 5 MSO points but 10% of the true MT.
The grid was equally weighted and does not represent the prevalence of patient characteristics. The analysis plan was written before this expanded run, informed by an earlier pilot; it was not preregistered. The error margins are descriptive study measures, not validated clinical acceptance thresholds. Only the default 7% estimator spread was evaluated; custom spread settings are outside this study.
20 versus 30 pulses
Gaussian response curve, true spread 7% of MT, no random-response mixture.
| Outcome | 20 pulses | 30 pulses |
|---|---|---|
| Mean absolute error (MSO points) | 0.99 | 0.79 |
| Signed bias (MSO points) | -0.06 | -0.03 |
| 95th percentile absolute error (MSO points) | 2.86 | 2.24 |
| Within ±5 MSO points · all runs | 99.60% | 99.92% |
| Within ±5% of true MT · all runs | 97.55% | 99.55% |
| Ready for review · all runs | 97.48% | 97.52% |
| Ready AND within ±5 MSO points · all-run yield | 97.15% | 97.48% |
| Within ±5 MSO points · among ready runs | 99.66% | 99.97% |
| Ready with error >10 MSO points · count | 0 | 0 |
At 30 pulses, the Monte Carlo 95% interval for the within-5-point rate was 99.84%–99.99%. Monte Carlo intervals describe repeated-simulation precision for this design; they are not patient-level MT confidence intervals. Ten extra pulses reduced robustness-grid MAE by 0.301 MSO points (paired interval 0.296–0.306).
At 30 pulses, 2,247 of 108,000 robustness runs were marked ready despite errors greater than 5 MSO points. Of these, 144 had errors greater than 10 points: 0.133% of all robustness runs, or 0.140% of ready runs. The largest ready-run error was an underestimation of 40.33 MSO points.
Accuracy across every stationary scenario
Explore a recorded simulation
Use the pulse slider to inspect delivered intensity, response and the evolving estimate. These are fixed synthetic study records; viewing them does not add observations to your assessment.
Blue line: estimated MT · dashed line: true MT · green circles: positive responses · brown squares: negative responses.
This is the largest observed review-ready error, not a representative case. True MT 90; Gaussian response spread 15%; random-response mixture 5%. An early positive at 37% MSO redirected sampling downwards. Two positives in the last ten pulses allowed the run to pass the 0/1/9/10 response-imbalance rule.
Stress-test results
Stress scenarios were analyzed separately and should not be pooled into stationary accuracy. The table shows 30-pulse plans; the report includes each of the 19 scenarios and both budgets.
| Scenario group | Histories | Mean absolute error (MSO points) | Ready for review |
|---|---|---|---|
| Abrupt threshold drift | 4,000 | 5.76 | 23.18% |
| Deliberately incorrect first response | 2,000 | 11.73 | 0.00% |
| Clinician ceiling of 60% MSO | 2,000 | 10.00 | 0.00% |
| Alternative starting intensities | 9,000 | 0.78 | 97.32% |
| True MT near output boundaries | 2,000 | 0.99 | 91.45% |
A stationary model lagged abrupt threshold changes. Wrong initial responses caused persistent errors but all 2,000 such runs were rejected by the readiness gate. All 2,000 ceiling-limited runs stopped after one pulse; no above-ceiling pulse was simulated. Safe stopping can leave a reachable threshold unresolved.
What the MTAT checks establish
37 of 37 isolated scalar reference cases matched. These retained numerical checks used original MTAT 2.1 scalar routines with environment stubs. They did not execute the full MTAT application or verify its interface, initialization pathways, stopping rules or readiness behavior end to end.
The 127,000-history simulation evaluated CTDS against known synthetic thresholds. It was not a head-to-head performance comparison with MTAT. Numerical agreement in a limited set of cases does not establish similar clinical performance or full-application equivalence.
Independent clinical validation is pending
Further work requires stronger estimate-quality checks, evaluation on held-out scenarios, complete original-application comparisons and a prospective clinician-supervised EMG study against an independent reference assessment. No clinical acceptance margin was established here. Visual-movement, active-MT and custom-spread performance were not validated.
Full report and reproducible study
Study conducted on website version 42. The estimator is unchanged in this publication update. The package includes the frozen code, analysis plan, seeds, raw endpoints, scenario summaries and pulse replays. Nine simulation checks passed; the retained 37 scalar checks also matched.
Source identity and method references
Tested source commit: 539405967be8691ceb59cc1bd6721754f342a487
Estimator SHA-256: 46b65b52c3b09b312f558947c57e323b2184b7b5263e2f81b469bde2c6261d7b
- Awiszus (2003) · TMS and threshold hunting ↗
- Mishory et al. (2004) · ML-PEST motor-threshold assessment ↗
- Ah Sen et al. (2017) · adaptive threshold hunting ↗
- Koponen & Peterchev (2022) · MTAT 2.0 misestimation study ↗
The published studies support the method’s context; they do not clinically validate CTDS.